A Close Look At The Latest Research Trends Within The Electro Hydraulic Servo Valve Market

Europe dominates the Electro Hydraulic Servo Market:

Europe has a major share of 42% in the Electro Hydraulic Servo Market. North America and the Asia Pacific region follow the suit. The region will grow at a CAGR of 3.13% and reach $660.5 million by 2023. The market is more prominent in countries such as Germany, US, UK, Canada, and China. This is due to their cost effectiveness in industrial applications. The key players such as Boeing and Lockheed Martin Aeronautics of aerospace and defence sectors in North America escalate the growth of hydraulic valves in the region.

electro.jpg

In Canada, electro hydraulic servo valves are used in turbines to control the steam, fuel, water discharge, and other applications. They are also used in machine tools for controlling the work piece. The growing demand of machine tools in construction and automotive industries will enhance the growth of the electro hydraulic servo valves in the region.

The iron and steel industry in Mexico employs servo valve and metal processing and machine tools. The growing demand fromthe iron and steel industry due to the demand from construction industries will drive the growth of the market in Mexico.

Selected Regulatory Analysis done in the Electro Hydraulic Servo Market report:

The hydraulic servo valve is employed in robotic applications to control the actuators. Growing use of industrial robots for welding, painting, assembling, and material handling in different industries,is bolsteringthe growth of the Electro Hydraulic Servo Valve Market. Metal processing machines such as mechanical presses, machine tools, and rolling mills have evolved from conventional mechanical control to CNC to improve speed, efficiency, and accuracy.

Computer numeric electro flow control valve can control various actuation functions in machines such as roller height adjustment in rolling machines, hammer drop in presses, and spindle/tool holder movement in machine tools. In earthquake simulation, seismic simulators incorporate electro hydraulic servo valves which actuate the machine’s movable platform to create vibrations like earthquakes.

Excerpts on Electro Hydraulic Servo Market Growth Factors:

• The miniature electric hydraulic valve is employed in industrial robots for motion control such as control of leg motion, joint motion, and arm motion. It is used in the robots which are used for material handling, painting, welding, and other automated industrial processes. The increasing demand for the industrial robots in automation enhances the growth of the market.

• In the aerospace industry, the directional control valve is used in the engine control system of the aircraft. It is also used for flight control, thrust vector control, and missile control application. Flight simulators also employ these valves for actuation of motion and control loading simulation.

• The hydraulic proportional valve is even used in material test machines, active suspension systems, mining machinery, and mill equipment.

To access / purchase the full report browse the link below:

https://industryarc.com/Report/18042/electro-hydraulic-servo-valve-market.html

Key Players of the Electro Hydraulic Servo Valve Market:
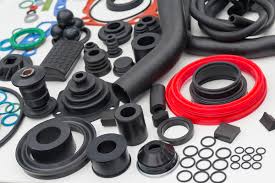
Moog provides proportioning valves that is used in industrial and marine applications. The main application includes basic metal processing, fatigue, material testing, rubber processing, robotics, etc. Rexroth Bosch Group produces twodirectional electro hydraulic servo valves suited for closed loop controlling of force, velocity, and pressure. Parker Hanfinn Corporation offers diverse electro hydraulic servo valves that are used in industrial and mobile machinery performance.

Aviation Industry Corporation of China (AVIC)

Honeywell International Inc Schneider Kreuznach

Eaton Corporation Plc
Oilgear Company
Voith GmbH

Electro Hydraulic Servo Valve Market is segmented as below:

The low cost solution for industrial and other low level applications in recent times has bolstered the growth of the Electro Hydraulic Servo Valve during the forecast period.

Electro Hydraulic Servo Valve Market by product
1.Single stage
2.Double stage
3. Others

Electro Hydraulic Servo Valve Market by type
1. Nozzle Flapper Valve
2. Jet Action Valve
3. Others (Dynamic Valve)
Electro Hydraulic Servo Valve Market by application
1. Industrial
2. Mobile/Marine
3. Aerospace & Defense
4. Others

• Electro Hydraulic Servo Valve Market by geography(covers 13+ countries)
• Electro Hydraulic Servo Valve Market by entropy
• Company Profiles
• Appendix: Abbreviations, Sources, Research Methodology, Bibliography, Compilation of Experts, Disclaimer.
What can you expect from the report?

The Electro Hydraulic Servo Valve Market Report is Prepared with the Main Agenda to Cover the following 20 points:

1. Market Size by Product Categories
2. Market trends
3. Manufacturer Landscape
4. Distributor Landscape
5. Pricing Analysis
6. Top 10 End user Analysis
7. Product Benchmarking
8. Product Developments
9. Mergers & Acquisition Analysis
10. Patent Analysis
11. Demand Analysis (By Revenue & Volume)
12. Country level Analysis (15+)
13. Competitor Analysis
14. Market Shares Analysis
15. Value Chain Analysis
16. Supply Chain Analysis
17. Strategic Analysis
18. Current & Future Market Landscape Analysis
19. Opportunity Analysis
20. Revenue and Volume Analysis

Does IndustryARC publish country, geography or application based reports in Electro Hydraulic Servo Valve Market ?
Yes, we do have separate reports as mentioned below:

1. North America Electro Hydraulic Servo Valve Market Report (2018-2023)
2. Europe Electro Hydraulic Servo Valve Market Size(2018-2023)
3. Asia Pacific Hydraulic Servo Valve Market Forecast(2018-2023)
4. Industrial Hydraulic Servo Valve Market growth(2018-2023)
5. Aerospace & Defence Hydraulic Servo Valve Market Share(2018-2023)
6. Mobile/ Marine Hydraulic Servo Valve Market Insights(2018-2023)

Does IndustryARC provide customized reports and charge additionally for limited customization?

Yes, we can customize the report by extracting data from our database of reports and annual subscription databases. We can provide the following free customization:
1. Increase the level of data in application or end user industry.
2. Increase the number of countries in geography chapter.
3. Find out market shares for other smaller companies or companies which are of interest to you.
4. Company profiles can be requested based on your interest.
5. Patent analysis, pricing, product analysis, product benchmarking, value and supply chain analysis can be requested for a country or end use segment.

Any other custom requirements can be discussed with our team; we can provide a separate quote based on your requirement. You can drop in an e-mail to sales@industryarc.com to discuss more about our consulting services.
Media Contact:
Mr. Venkat Reddy
Sales Manager
Email 1: sales@industryarc.com
Or Email 2: venkat@industryarc.com
Contact Sales: +1-614-588-8538 (Ext-101)

About IndustryARC:

IndustryARC is a Research and Consulting Firm that publishes more than 500 reports annually, in various industries such as Agriculture, Automotive, Automation & Instrumentation, Chemicals and Materials, Energy and Power, Electronics, Food & Beverages, Information Technology, Life sciences &Healthcare.
IndustryARC primarily focuses on Cutting Edge Technologies and Newer Applications in a Market. Our Custom Research Services are designed to provide insights on the constant flux in the global supply-demand gap of markets. Our strong team of analysts enables us to meet the client research needs at a rapid speed, with a variety of options for your business.
We look forward to support the client to be able to better address their customer needs, stay ahead in the market, become the top competitor and get real-time recommendations on business strategies and deals. Contact us to find out how we can help you today.

A Close Look At The Latest Research Trends Within The Wireless Electric Vehicle Charging (WEVC) Market

North America with major share in the Electric Vehicle Wireless Charging Market:

North America is set to dominate the electric vehicle wireless charging market with a value share of 89% in 2016. In theAsia-Pacific, trials are being conducted to test dynamic charging, a wireless charger technology that can power the battery of electric vehicles while moving.APAC is estimated to grow prominently with aCAGR of 96.09% during 2018-2023, owing to the increasing deployment of electric vehicles in countries such as China, Korea, Japan and India. According to IEA, in 2016, China is the largest electric car’smarket that has accounted for more than 40% of the electric cars sold in the world.Automotive wireless charginghas witnessed a surge in demand for electric vehicles in the coming years,coupled with the rising number of investments related to the development of better charging systems from Government as well as thepublic sector.

Wireless EV-520501064

Selected Charging Type Analysis done in the Electric Vehicle Wireless Charging Market Report:

Wireless power transfer for electric vehicles are gaining momentum when compared to wired power charging, resulting inthe inconveniences caused by the wired PEV that includes mechanical, electrical hazards, and others, thus creating a huge opportunity for the growth of the lucrative market.Recently, wireless power charging of electric vehicles is gaining huge momentum owing to the rising demand for electric mass transportation means like electric trains, buses, utility vehicles, and many others.In 2023, Dynamic charging type electric vehiclesvalue is anticipated to generate revenues of $67.39M with a CAGR of 92.16% in the forecast period.

According to the IEEE journal based on economic analysis of the dynamic charging electric vehicle, the total cost comparison of the stationary charging system and dynamic charging system is calculated for eighteenbuses, which are operated for 10 years. The total cost of the stationary charging EV system is $11.83 million, whereas the dynamic charging EV system needs $9.37 million.Thus,the dynamic charging system requires more investments on the power tracks than the stationary charging system.Stationary charging electric vehicles are anticipated to reach a revenue of $1231millionby 2023, growing at a CAGR of 97.66% throughout the forecast period 20182023.
Excerpts on Electric Vehicle Wireless Charging Market Growth Factors

• New governmental incentives globally are projected to enhance EV adoption and technology development across all the parts of the globe.

• Future electric vehicles could recharge wirelessly while driving. While driving on the highway, drawing wireless power directly from plates installed in the roadwould make it possible to drive for miles without having to plug-in and this on-board battery wirelesswill drive the adoption rate.

• Wireless charging stations are being developed as a part of government initiative programs and EV manufacturers are being involved in the development of wireless charging spots in the parking locations.

• Electric vehicle manufacturersareinstalling vehicle’s wireless charging systems in oil and gas stations for easy charging, and this is to enhance the salesof auto wireless charger.
To access / purchase the full report browse the link below:

https://industryarc.com/Report/16306/electric-vehicle-charging-services-market.html

Key players of the Electric Vehicle Wireless Charging Market:

Qualcomm Inc., BMW AG, Hella Aglai Mobile Vision, Evatran Group, Toyota Kirloskar Group, Dailmer AG, Bombardier, and OLEV Technologies are some of the key players of global wireless electric vehicle charging systems in the electric vehicles market.Advent of new companies will drive innovations since the key players will strive to maintain their dominance.EV wireless charging market witnessed alarge number of collaborationsand agreements in the mentioned period. TDK, Qualcomm joint venture,and MomentumDynamics Corporation launching zero emission electrified bus transportation with wireless technology are the recent merger and developments in the public sector that isdriving the growth.

Electric Vehicle Wireless Charging Market report is segmented as below

The global Electric Vehicle Wireless Charging Market study across various end user industries is incorporated in the report:

A. Electric Vehicle Wireless Charging Market By Type

1. PHEV
2. HEV
3. BEV

B. Electric Vehicle Wireless Charging Market By Power Supply

1. 3-<11 kW
2. 11-50 kW
3. > 50 kW

C. Electric Vehicle Wireless Charging Market By Charging
1. Stationary
2. Dynamic

D. Electric Vehicle Wireless Charging Market by Geography (covers 10+ countries)
E. Electric Vehicle Wireless Charging Market Entropy

Companies Cited / Interviewed in Electric Vehicle Wireless Charging Market:
1. Witricity Corporation
2. Hevo Inc.
3. TDK Corporation
4. Momentum Dynamics Corporation
5. Plugless Power
6. Mojo Mobility
7. Toshiba Corporation
8. Company 8
9. Company 9
10. Company 10+

What can you expect from the report?
The Electric Vehicle Wireless Charging Market Report is Prepared with the Main Agenda to Cover the following 20 points:

1. Market Size by Product Categories & Application 11. Demand Analysis (Revenue & Volume)
2. Market trends & Relevant Market Data 12. Country level Analysis
3. Manufacturer Landscape 13. Competitor Analysis
4. Distributor Landscape 14. Market Shares Analysis
5. Pricing Analysis 15. Value Chain Analysis
6. Top 10 End user Analysis 16. Supply Chain Analysis
7. Product Benchmarking 17. Strategic Analysis
8. Product Developments 18. Current & Future Market Landscape Analysis
9. Mergers & Acquisition Analysis 19. Opportunity Analysis
10. Patent Analysis 20. Revenue and Volume Analysis

Frequently Asked Questions:
Q. Does IndustryARC publish country or application based reports in Electric Vehicle Wireless Charging Marketsegment?
Response: Yes, we do have separate reports as mentioned below:

1. Americas Electric Vehicle Wireless Charging Market Report(2018-2023)
2. Asia Pacific Electric Vehicle Wireless Charging Market Share(2018-2023)
3. Europe Electric Vehicle Wireless Charging Market Growth(2018-2023)
4. Power Supply Electric Vehicle Wireless Charging Market Analysis(2018-2023)
5. ChargingElectric Vehicle Wireless Charging Market Forecast(2018-2023)
Q. Does IndustryARC provide customized reports and charge additionally for limited customization?
Response:Yes, we can customize the report by extracting data from our database of reports and annual subscription databases. We can provide the following free customization:
1. Increase the level of data in application or end user industry.
2. Increase the number of countries in geography chapter.
3. Find out market shares for other smaller companies or companies which are of interest to you.
4. Company profiles can be requested based on your interest.
5. Patent analysis, pricing, product analysis, product benchmarking, value and supply chain analysis can be requested for a country or end use segment.

Any other custom requirements can be discussed with our team, drop an e-mail to sales@industryarc.com to discuss more about our consulting services.

Media Contact:
Mr. Venkat Reddy
Sales Manager
Email 1: sales@industryarc.com
Or Email 2: venkat@industryarc.com
Contact Sales: +1-614-588-8538 (Ext-101)

About IndustryARC:IndustryARC is a Research and Consulting Firm that publishes more than 500 reports annually, in various industries such as Agriculture, Automotive, Automation & Instrumentation, Chemicals and Materials, Energy and Power, Electronics, Food & Beverages, Information Technology, Life sciences &Healthcare.

A Close Look At The Latest Research Trends Within The Electric Vehicle Market

Electrification is the most viable way to achieve clean and efficient transportation that is crucial to the sustainable development of the whole world. The present division of year says, the electric vehicle technologyincluding hybrid electric vehicles (HEVs), plug-in hybrid electric vehicles (PHEVs), and pure battery electric vehicles (BEVs) will dominate the clean vehicle market.

Asia-Pacific Dominates with Major Growth in the Electric Vehicle Market:

Geographically, the Electric vehicle market is present in regions of North America, Europe, Asia-Pacific and rest of the world. The new plea of cars hasincreased by 70% from 2016. In 2016, over 550,000 vehicles were adopted globally which include both battery electric vehicle and plug-in hybrid vehicle. Research say China is expected to extend its industry leadership by making gains across all dimensions of the supply side EVs, including current projected production of EVs and their components. Overall, Germany and United States of America also perform well in the industry, with number of major changes in EV production. These countries saw slight fall of market, due to electric motor production because of China’s expansion.

electric veicle.jpg

Sales Analysis Done in Electric Vehicle Market Report:

The higher capacity batteries sales has increased. It is noticed that direct re-use is always cheaper than batteries under similar productivity environment.ThePHEV is mapping towards saleand expected to come up with best price deal. The pricing concept gives you an idea about the estimation price of the present market, as the advancement in electric motor transmission batteries are under major development. The expansion and product launch will elucidate establishment cost and electric automobilesto sustain for longer period of time.

Selected Type and Application Analysis Done in the Electric Vehicle Market Report:

The uptake of EVs is the result of several factors, including strong technological progress, cost reductions and policy support, including purchase incentives, driving and parking access advantages, and increased public charging infrastructure availability. The BEVs dominated the sales over the hybridcarsin most countries until 2015. But, the plug-in vehicle (PHEV) sales have grown rapidly in the past two years and as of now the PHEVs market is nearly equal to BEV sales worldwide. PHEVs have a considerable range of advantages due to its ongoing battery performance improvements and making feasible in cost reduction driving to achieve maximum share in the marketplace.
Excerpts on Electric Vehicle Market Growth Factors

• After the diesel emission scandal, in the city of California,$44 million investment was made by Electrify America to bring hundreds of electric vehicles to the city. The project includes 260 electric vehicles. The vehicles can locate nearby cars with an app and drive them anywhere within a 13 square mile radius.The vehicles will be available in early 2019.
• ISRO announced to start its major project on lithium-ion cell technology to bring the adoption of non-exclusive basis for usage in automobiles. This initiative will accelerate the development of indigenous electric vehicle industry.
• The growing adoption of electric carsis creating new opportunity for Volkswagen. It says that quantum computing technology could help to build customized batteries, with a chemical blueprint that will speed up development and production of electric vehicles batteries. This will build a specialized and customized car battery for future green cars.
To access / purchase the full report browse the link below

https://industryarc.com/Report/18508/electric-vehicle-market-research-report-analysis.html
Key players of the Electric Vehicle Market:

At present, progress is the key strategy that drives the market, accounting for around 44% of total strategies adopted by key players. The major players profiled in this report include Tesla, BMW Group, Nissan Motor Corporation, Toyota Motor Corporation, Volkswagen AG, General Motors, Dailmer AG, and Energica Motor Company S.P.A. These are the leading market players focusing to expand their business operations in emerging countries.Among all the continents APAC is the emerging region where investors are more focusing on to introduce innovative solutions. Some of the well footholds EVs Cars in the present market areTesla Model S, Nissan Leaf, BMW i3, Mitsubishi iMiEV, Ford Focus EV; these are BEV available models. BMW i3 REX, BMW i8, Cadillac ELR, Ford Fusion Energi, Ford Cmax Energi, Toyota Prius Plugin and others are the PHEV available type models. Audi Q5 Hybris, Acura ILX hybrid, Cadillac escalade Hybris, BMW Active Hybrid 3 and other are HEV available type models.

The Electric Vehicle Market Report is Segmented as Below:

A. Wireless Mesh Networking Market- By Type

1. Battery Electric Vehicle (BEV)
2. Hybrid Electric Vehicle (HEV)
3. Plug-in Hybrid Electric Vehicle (PHEV)

B. Electric Vehicle Market – By Modules

1. Body & Chassis

1.1 Central Body Module
1.2 In-Vehicle Networking
1.3 HVAC
1.4 Touch Control Solutions
1.5 Door/ Window lift/Seat Module
1.6 Lighting
1.7 High End Body Control Module

2. Powertrain

2.1 Engine Management
2.2 Alternator Regulator
2.3 Battery Monitoring
2.4 Fan Control
2.5 Exhaust System
2.6 Intelligent Watchdog System
2.7 Turbo Charger
2.8 Fuel Pump
2.9 Electric Pumps, Motor Control and Auxiliaries
2.10Transmission and Gearbox

3. Infotainment
4. Safety & Security

4.1 Air bag
4.2 Car Access
4.3 Remote Keyless Entry
4.4 Immobilizer
4.5 Passing Entry/Go

5. Electric Power Steering
6. Advanced Driver Assistance Systems (ADAS)

C. Electric Vehicle Market by Geography (covers 10+ countries)
D. Electric Vehicle Entropy Market
E. Manufacturer Citied / Interviewed

1. Bollore
2. BYD Company Motors
3. Chevrolet
4. Fiat
5. Hyundai
6. Mercedes-Benz
7. Renault
8. Company 8
9. Company 9
10. Company 10
11. Company 15+

What can you expect from the report?
The Electric Vehicle Market Report is prepared with the main agenda to cover the following 20 points:

1. Market Size by Product Categories & Application 11. Demand Analysis (Revenue & Volume)
2. Market trends & Relevant Market Data 12. Country level Analysis
3. Manufacturer Landscape 13. Competitor Analysis
4. Distributor Landscape 14. Market Shares Analysis
5. Pricing Analysis 15. Value Chain Analysis
6. Top 10 End user Analysis 16. Supply Chain Analysis
7. Product Benchmarking 17. Strategic Analysis
8. Product Developments 18. Current & Future Market Landscape Analysis
9. Mergers & Acquisition Analysis 19. Opportunity Analysis
10. Patent Analysis 20. Revenue and Volume Analysis

FAQs:
Q. Does IndustryARC publish country or application based reports Electric Vehicle Market segment?
Response: Yes, we do have separate reports as mentioned below:

1. Americas Electric Vehicle Market Share(2018-2023)
2. Europe Electric Vehicle Market Report(2018-2023)
3. Asia-Pacific Electric Vehicle Market Analysis (2018-2023)
4. TypeElectric Vehicle Market Growth(2018-2023)
5. ModuleElectric Vehicle Market Insights(2018-2023)
Q. Does IndustryARC provide customized reports and charge additionally for limited customization?
Response:Yes, we can customize the report by extracting data from our database of reports and annual subscription databases. We can provide the following free customization:
1. Increase the level of data in application or end user industry.
2. Increase the number of countries in geography chapter.
3. Find out market shares for other smaller companies or companies which are of interest to you.
4. Company profiles can be requested based on your interests.
5. Patent analysis, pricing, product analysis, product benchmarking, value and supply chain analysis can be requested for a country or end use segment.

Any other custom requirements can be discussed with our team, drop an e-mail to sales@industryarc.com to discuss more about our consulting services.

Media Contact:
Mr. Venkat Reddy
Sales Manager
Email 1: sales@industryarc.com
Or Email 2: venkat@industryarc.com
Contact Sales: +1-614-588-8538 (Ext-101)

About IndustryARC:IndustryARC is a Research and Consulting Firm that publishes more than 500 reports annually, in various industries such as Agriculture, Automotive, Automation & Instrumentation, Chemicals and Materials, Energy and Power, Electronics, Food & Beverages, Information Technology, Life sciences & Healthcare.

A Quick Look At The Latest Happenings In The Elastomers Market

Asia Pacific continues to dominates the Elastomers Market:

Asia Pacific continues to lead the Elastomers Market and this growth is due to the increasing automotive and manufacturing industry in the region with China, India, and Thailand performing significantly. Footwear is the third largest sector in the Asia Pacific Elastomers Market. The transformation from mechanical equipment to electrical devices like motors and transformers in factories will increase the productivity and enhances the growth of elastomer molds. The APAC Elastomer market is expected to reach $57.31 Billion by 2023 at a CAGR of 6.35%.

Elastomers

There is a strong growth estimated for Polyurethane (PU) Elastomers in the American and European regions during the forecast period. Elastomers have unique properties such as toughness, strength, flexibility strength, abrasion resistance, and shock absorbency. Hence, they are used to adjust the nature of raw materials. In the Americas, the automotive and industrial manufacturing industry make use of Elastomers to a large extent. Manufacturing of automobile parts in Mexico enhances the demand for Ethylene Propylene Elastomer in the region. U.S. holds a major share in fluorocarbon Elastomers due to high scale of production and construction activities, followed by Canada.
Selected Type of Regulatory Analysis done in the Elastomers Market report:

United States Pharmacopeia (USP):
USP specifications cover blood and body fluid compatibility/contact applications. USP tests are designed to provide information on biological effects of polymer materials used in containers. There are six classes into which a polymer may be placed, depending on its performance in specific USP biological tests. Each increasing class number, from I to IV, requires that a polymer be subjected to additional tests, with each level using more extraction vehicles than the previous class. There is also a range of increasingly higher extraction temperatures which may be selected to further characterize the material.

Underwriters Laboratories (UL)
Underwriters Laboratories is an independent, not-for-profit product safety and testing certification organization based in the U.S. Common tests are UL-94 (vertical and horizontal burn test further categorized under HB, V0, V1, or V2), VTM (thin film burn test) and VW (vertical wire burn test). Typical applications covered by UL specifications include hand-held electronics, business machines and appliances.

Military Specifications (MIL)
Certain US military and non-military applications may require military specifications. Such specifications include areas such as fungal growth, dimensional stability and many other material properties. In the TPE world, applications requiring military specs include umbilical cables, field-use flexible cords, underground cable and ship-to-shore cable.

Canadian Standards Association (CSA)
CSA is the principle Canadian standards body that sets performance criteria and test methods in certain applications. This is a body similar to that of ASTM, UL, DOT, FDA and MIL in the United States.
Excerpts on Market Growth factors mentioned in the Elastomers Market report:

• Increasing demand for light weighted automotive components pushes elastomers production. This leads to the development of lightweight and fuel efficient engines, with reduced noise.

• Elastomers are used as a substitute to metals. This factor is slated to create a surging demand for these products in the coming years.

• Elastomers are used to make O-rings, water seals, and puncture resistant fill. The ease with which these materials are molded, along with its lightweight and durability features makes them useful in important applications.

• Replacing fossil based feedstock with bio renewable sources produces a sustainable environment. This drives the demand for Nitrile elastomer.

• Elastomers are used in many types of footwear, ranging from sports to fashion shoes. They do not spoil the design potential.
To access / purchase the full report browse the link below:

https://industryarc.com/Report/18133/elastomers-market.html

Key players of the Elastomers Market:

Dow Chemical Company provides crop protection, seed/plant biotechnology products, and urban pest management solutions. It even delivers products like architectural and industrial coatings. Covestro AG prepares high performance plastics and manufactures polymers. It markets its products to industries like automotive, construction, health, and electronics. Huntsman Corporation serves end user industries like transportation, construction, home life, energy and fuels.

Companies Cited/Interviewed in Elastomers Market Report:

Advanced Elastomer Systems :
BASF SE
Covestro AG
EI Dupont De Nemours and Company
Lanxess AG
Lyondellbasell industries
YantaiWanhua Polyurethane
Zeon Corporation
Company 9
Company 10+
Elastomers Market is segmented as below:

Elastomers Market by type
1. Thermoset Elastomers
2. Thermoplastic Elastomers
3. Vulcanized Thermoplastic Elastomer
4. Co plastic Thermoplastic Elastomer
5. Thermoplastic PVC

Thermoset Elastomers
a. Natural rubber
b. Synthetic rubber
• Styrene Butadiene Rubber
• Polybutadiene Elastomer
• Nitrile Elastomers
• Acrylic Elastomers
• Silicone Elastomers
• Fluoro Elastomers
• Others

Elastomers Market by end user
1. Automotive
2. Medical
3. Industrial
4. Consumer Electronics
5. Consumer goods
6. Others

1. Automotive
2. Medical
3. Industrial
4. Consumer Electronics
5. Consumer Goods
6. Others

Elastomers Market by vehicle type

1. Passenger vehicles
2. Commercial vehicles
3. Others.

Elastomers Market by geography(20+ countries)

Elastomers Market by entropy
Company profiles
Appendix: Abbreviations, Sources, Research Methodology, Bibliography, Compilation of Experts, Disclaimer.
What can you expect from the report?

The Elastomers Market Report is prepared with the Main Agenda to Covers the following 20 points:

1. Market Size by Product Categories
2. Market trends
3. Manufacturer Landscape
4. Distributor Landscape
5. Pricing Analysis
6. Top 10 End user Analysis
7. Product Benchmarking
8. Product Developments
9. Mergers & Acquisition Analysis
10. Patent Analysis
11. Demand Analysis (By Revenue & Volume)
12. Country level Analysis (15+)
13. Competitor Analysis
14. Market Shares Analysis
15. Value Chain Analysis
16. Supply Chain Analysis
17. Strategic Analysis
18. Current & Future Market Landscape Analysis
19. Opportunity Analysis
20. Revenue and Volume Analysis
Does IndustryARC publish country, geography or application based reports in Elastomers Market?

Yes, we do have separate reports and database as mentioned below:

1. North America Elastomers Market Share(2018-2023)
2. Latin America Elastomers Market Size(2018-2023)
3. Europe Elastomers Market Growth(2018-2023)
4. Asia Pacific Elastomers Market Analysis(2018-2023)
5. Automotive Elastomers Market Insights(2018-2023)
6. Medical Elastomers Market(2018-2023)
7. Industrial Elastomers Market(2018-2023)
8. Consumer Electronics Elastomers Market(2018-2023)
9. Consumer Goods Elastomers Market(2018-2023)

Does IndustryARC provide customized reports and charge additionally for limited customization?

Yes, we can customize the report by extracting data from our database of reports and annual subscription databases. We can provide the following free customization:

1. Increase the level of data in application or end user industry.
2. Increase the number of countries in geography or product chapter.
3. Find out market shares for other smaller companies or companies which are of interest to you
4. Company profiles can be requested based on your interest.
5. Patent analysis, pricing, product analysis, product benchmarking, value and supply chain analysis can be requested for a country or end use segment.
Any other major customizations can be discussed with our team and can provide a separate quote based on your requirements. You can drop an e-mail to sales@industryarc.com to discuss more about our consulting services.
Media Contact:
Mr. Venkat Reddy
Sales Manager
Email 1: sales@industryarc.com
Or Email 2: venkat@industryarc.com
Contact Sales: +1-614-588-8538 (Ext-101)

About IndustryARC:

IndustryARC is a Research and Consulting Firm that publishes more than 500 reports annually, in various industries such as Agriculture, Automotive, Automation & Instrumentation, Chemicals and Materials, Energy and Power, Electronics, Food & Beverages, Information Technology, Life sciences &Healthcare.

IndustryARC primarily focuses on Cutting Edge Technologies and Newer Applications in a Market. Our Custom Research Services are designed to provide insights on the constant flux in the global supply-demand gap of markets. Our strong team of analysts enables us to meet the client research needs at a rapid speed, with a variety of options for your business.

We look forward to support the client to be able to better address their customer needs, stay ahead in the market, become the top competitor and get real-time recommendations on business strategies and deals. Contact us to find out how we can help you today.

A Close Look At The Latest Research Trends Within The Dynamometer Product & Services Market

North America continues to lead Dynamometer Products & Services market share during 2018-2023:
The market for dynamometer in 2014 was leading in North America with 38% share, followed by Europe and Asia-Pacific (APAC) with 28% & 23% share, respectively. In Europe and North America, the dynamometer industry is matured as testing equipment has been practiced since long time. However, Eastern Europe and South American countries such as Mexico and Brazil, are the potential market due to increasing production capacity. On the other hand, the test equipment market of Asia-Pacific and RoW regions are emerging significantly due to the increase in the number of vehicle assembly lines and engine plants, with the growing demand for light, medium and heavy vehicles in countries such as China, India, South Korea, and so on.

dynamometer-500x500
North America is the largest market for dynamometers, accounting for revenue of $366.2 million in 2017. This segment is projected to grow to $541.78 million by 2023 as growing demand for hydraulic dynamometers, particularly in the energy and power industry, drive the market. RoW region is forecast to grow at a very slow CAGR of 0.4%, as lack of growth of the manufacturing segment in the Middle East slows down the market. The APAC region is forecast to exhibit the highest CAGR of 9.8% through 2023. The significant investment in the manufacturing sector over the next few years will drive this growth.
In North America, Eddy Current Dynamometers type segment is leading the market that had registered $175.8 million revenue in 2017, and is projected to reach $238.388 million by 2023 at 5.1% CAGR.
Selected / Sample Analysis done in the Dynamometer Products & Services Report:
The value chain analysis explains the comprehensive evaluation of each activity involved in the processing of any product/service, and finally delivering it to the end-users. Each stage across the value chain of a product or service is associated with creating some sort of monetary value. The value chain analysis can offer the company to examine every activity across the value chain, and identify the steps where elimination or modification is essential.
Dynamometers can be primarily categorized as devices based on type of load induced and the resistive force coupled in the mechanism. The requirements and manufacturing technology for each of these respective devices differ significantly. The Research and Development is generally an in-house facility responsible for evaluating several parameters and specifications that are required to design the signaling devices. These parameters are mainly controlled by the applications where signaling devices need to be integrated. The applications for these devices fall primarily into two categories: manufacturing, and testing based on the end user applications. Based on these categories, the specifications for dynamometers are being laid while simultaneously complying with industrial regulations and certification standards.
Once these specifications are laid down, the designing phase deals with the development of a viable product. The prototypes are passed through various iterations until the desired result is achieved. This phase is also responsible for listing the required processing technology, materials and components in order to manufacture the dynamometer. The successive step deals with procuring required components and materials, handled entirely by secondary activity known as inbound logistics. The manufacturing equipment providers provide the necessary machinery and services support for producing the signaling devices. These devices are simultaneously tested and dispatched for outbound logistics. The outbound logistics deals with the pricing and distribution channel of these devices. After the end-user has acquired the requisite dynamometer, the dynamometer manufacturers offer all sorts of installation and maintenance services till the end of the product lifecycle.
Excerpts on Market Growth Factors Mentioned in the Dynamometer Products & Services Report:
In automotive applications, enhanced accuracy, increasing demand for vehicle quality standards, and increasing awareness towards quality in developing countries are the major drivers for dynamometer that are expected to drive market growth.
Electric Motors being the key actuators are creating and maneuvering several industrial operations to offer comprehend massive expansion in their market demand.
The Automotive industry has been a prominent sector observing decent growth rates, particularly in the developing regions including Asia-Pacific (APAC) and Latin America. The growing automotive industry is set to spur the demand for dynamometers.
To access / purchase the full report browse the link below

https://industryarc.com/Report/97/global-dynamometer-market.html

Key Players of the Dynamometer Products & Services Market:
The key players in the market includes Horiba (Japan), Meiden America, Inc. (U.S.), Mustang Dynamometer (U.S.), Kistler (Switzerland), Piper test and measurement (U.K.), Wineman Technology, Inc. (U.S.). Horiba (Japan) is the leading manufacturer of dynamometers, which are used in applications to test engines, power train, chassis, motors and so on. Automotive test system is the leading segment for Horiba. They have acquired MIRA, Ltd, a U.K. based vehicle engineering consultancy and testing service provider to complement their existing line of testing equipment products and extend their dominance in the dynamometer market. Horiba is the leading player in the dynamometer industry, with a market share of 17.02% in 2017, owing to the wide range of product portfolio combined with strong distribution channels worldwide.
Horiba, followed by Meiden America, a subsidiary of Meidensha group with a market share of 14.8% in 2017, is the second leading manufacturer of dynamometer. Meiden America relies on the advanced technologies, strong R&D, and comprehensive product range to meet the emerging demand of test products. Moreover, the continuous investments in R&D activities are likely to increase the market share of the company.
Kristler and Mustang Dynamometer holds the market share of 12.1% and 10.6% respectively in the dynamometer market. With the varied product line across various end applications are likely to fuel their market share in the industry. Also, the strong supply chain across the globe, and years of expertise in the market will help them to extend their dominance in the market.
Dynamometer Products & Services Market Report is Segmented as below.
Dynamometer Products & Services Market By Type :

Absorption
Transmission
Motoring
Dynamometer Products & Services Market By Resistance Provided/Absorption Drive Units:
Solid Friction Dynamometers.
Rope Brake Dynamometer.
Prony Brake Dynamometer.
Fan Brake Dynamometer.
Hydraulic/ Liquid Friction Dynamometers.
Constant Filled Hydraulic Dynamometer.
Variable Filled Hydraulic Dynamometer.
Eddy Current Dynamometer.
Dry Gap Eddy Current Dynamometer.
Wet Gap Eddy Current Dynamometer.
Magnetic Powder.
Hysteresis
Dynamometer Products & Services Market By Transmission:
Epicyclical Train Dynamometer.
Belt Transmission Dynamometer.
Tantham Dynamometer.
Von Hafner Transmission Dynamometer.
Dynamometer Products & Services Market By Transmission:
Epicyclical Train Dynamometer.
Belt Transmission Dynamometer.
Tantham Dynamometer.
Von Hafner Transmission Dynamometer.
Dynamometer Products & Services Market By Measurement:
Force
0-250 N (Precision Machining).
250n-1000n (Human Force).
1kn-8kn (Turning, Milling and Grinding).
8kn-60kn (Drilling, Milling and Grinding).
Power
0 – 700kw (Car Engines).
1mw-8mw (High Performance Car Engines, Wind Turbines).
8mw- 900mw (Wind & Gas Turbines, Jet Engines).
Dynamometer Products & Services Market By End- User/ Services Industries:
Manufacturing Industries.
Motors/Generators.
Pumps/Compressors.
Hydraulic & Pneumatic Equipment.
Propellers/Turbines.
Machine Tools.
Automotive & Aerospace Industry.
Engines
Power Trains.
Chassis
Gearbox
Kinesiology
Human Kinetics.
Physical Status.
Dynamometer Products & Services Market By Geography ( Covers 16+ Countries )
Dynamometer Products & Services Market Entropy
Companies Cited / Interviewed in Dynamometer Products & Services Market:

  • AW DYNAMOMETER, INC.
  • BURKEY E. PORTER MACHINERY COMPANY
  • DYNAPRO DYNAMOMETER LTD.
  • DYNE SYSTEMS, INC.
  • DYNOCOM INDUSTRIES INC.
  • DYNOSTAR DYNAMOMETERS
  • DYNO DYNAMICS
  • DYNO ONE, INC.
  • KAHN INDUSTRIES, INC.
  • KLAS REALTIME SYSTEMS, LTD.
  • LAND AND SEA, INC.
  • MAHA MASCHINENBAU HALDENWANG GMBH & CO. KG
  • MAINLINE DYNOLOG DYNAMOMETERS
  • MUSTANG DYNAMOMETER
  • PIPER TEST AND MEASUREMENT LTD.
  • POWER TEST DYNAMOMETERS
  • SAKOR TECHNOLOGIES, INC.
  • WINEMAN TECHNOLOGY INCORPORATED
    Company 19
    Company 20+

What can you expect from the report?

The Dynamometer Products & Services Market Report is Prepared with the Main Agenda to Cover the following 20 points:
Market Size by Product Categories
Market trends
Manufacturer Landscape
Distributor Landscape
Pricing Analysis
Top 10 End user Analysis
Product Benchmarking
Product Developments
Merges & Acquisition Analysis
Patent Analysis
Demand Analysis ( By Revenue & Volume )
Country level Analysis (10+)
Competitor Analysis
Market Shares Analysis
Value Chain Analysis
Supply Chain Analysis
Strategic Analysis
Current & Future Market Landscape Analysis
Opportunity Analysis
Revenue and Volume Analysis
Frequently Asked Questions:

Does IndustryARC publish country, or application based reports in Dynamometer Products & Services Market?

Response: Yes, we do have separate reports and database as mentioned below:

North America Market for Dynamometer Products & Services Share(2018-2023)
South and Central America for Dynamometer Products & Services Report(2018-2023)
Europe Market for Dynamometer Products & Services Analysis(2018-2023)
Asia-Pacific Market for Dynamometer Products & Services Growth(2018-2023)
Manufacturing Industries Market for Dynamometer Products & Services Forecast (2018-2023)
Automotive & Aerospace Industry Market for Dynamometer Products & Services Insights(2018-2023)
Kinesiology Market for Dynamometer Products & Services (2018-2023)

Does IndustryARC provide customized reports and charge additionally for limited customization?

Response: Yes, we can customize the report by extracting data from our database of reports and annual subscription databases. We can provide the following free customization

Increase the level of data in application or end user industry.
Increase the number of countries in geography or product chapter.
Find out market shares for other smaller companies or companies which are of interest to you.
Company profiles can be requested based on your interest.
Patent analysis, pricing, product analysis, product benchmarking, value and supply chain analysis can be requested for a country or end use segment.

Any other major customizations can be discussed with our team, we can provide a separate quote based on your requirements. You can drop in an e-mail to sales@industryarc.com to discuss more about our consulting services.

Media Contact:
Mr. Venkat Reddy
Sales Manager
Email 1: sales@industryarc.com
Or Email 2: venkat@industryarc.com
Contact Sales: +1-614-588-8538 (Ext-101)
About IndustryARC:
IndustryARC is a Research and Consulting Firm that publishes more than 500 reports annually, in various industries such as Agriculture, Automotive, Automation & Instrumentation, Chemicals and Materials, Energy and Power, Electronics, Food & Beverages, Information Technology, Life sciences & Healthcare.
IndustryARC primarily focuses on Cutting Edge Technologies and Newer Applications in a Market. Our Custom Research Services are designed to provide insights on the constant flux in the global supply-demand gap of markets. Our strong team of analysts enables us to meet the client research needs at a rapid speed, with a variety of options for your business.
We look forward to support the client to be able to better address their customer needs, stay ahead in the market, become the top competitor and get real-time recommendations on business strategies and deals. Contact us to find out how we can help you today.

The Latest Developments & Future Outlook Of The DSRC Technology Market

Asia-Pacific dominates with major share and growth in the DSRC Technology Market:

Asia-Pacific is the leading market for DSCR Technology market for the forecast period of 2018-2023. The Asia-Pacific market is expected to register a value of $70150.80thousand in 2023. China is the dominant region for DSRC Technology market,followed by Europe the second leading region to gain $20929.30 thousand in 2017, which is expected to grow at a CAGR of 9.82% to reach a value of $36705.80 thousands by 2023. American market is witnessed to grow at a faster CAGR of 11.92% to reach a value $12212.80 thousands by 2023. Freight transportation system is one of the sector backing North American economy. DSRC Technology are to be combinedin commercial vehicles for traffic management, vehicle movement monitoring and others.

DSRC

Selected Extracts Analysis done in the DSRC Technology Market Report:

DSRC Marketshipment market is segmented into Transceivers, which is further sub-segmented into Onboard Unit and Roadside Unit. The Onboard Unit segment accounted for total sales of $76.4 million in 2017, which is projected grow at a CAGR of 5.8% to register a value of $106.9 million by 2023. The market for DSRC Roadside Unit was estimated to be around $24.2 million in 2017. This is projected to decline with a negative CAGR of 5% in the forecast period 2018-2023. In the future,the RSUs market will become successful for a specific year 2021, whichit will reach a value up to $21.7 million. In vehicle segment, passenger vehicles and commercial vehicles are two type of vehicles segment, among which passenger holds the maximum share in transportation vertical. The passenger vehicle market is expected to grow at a CAGR of 6.8% to register a value of $90.3 million by 2023.The commercial vehicles segment is expected to grow at a CAGR of 1.0% to reach register a value of $16.7 million by 2023.

Excerpts on DSRC Technology Market t Growth Factors:

  • DSRC playsa significant rolein enhancing safety of vehicles by providing communication on both V2V and V2I networks.Thus,several applications are being developed as vehicle monitoringactivities are increasing the market for dedicated short range communication market.
  • Road transportation is undergoing a diverse technological evolution to increase the safety standardsof drivers, vehicles and pedestrian. With the advancementof variousvehicular communications, technologies are incorporated that will help the market to grow.
  • Growing promising governmental regulations and increasing safety concern among common people will drive the market for the adoption of DSRC Technology and setting to exhibit significant growth.

To access / purchase the full report browse the link below

https://industryarc.com/Report/18041/dsrc-technology-market.html

Key players of the DSRC Technology Market:

The major companies related to DSRC technology comprise of Kapsch Group, Norbit, Arada Systems, Savari, Codha Wireless among others. Kapsch Traffic AG is known to serve in the regions of Europe and America with applications such as High speed open road tolling, lane based ETC and HOT lanes, ITS safety and security services, etc.Cohda Wireless is known for designing of productsand has it’s reach in the regions of Asia-Pacific and America, for its V2X communication application. Savariis established for serving in hardware and software solutions in application area of Safety and Tooling. In several years, DSRC Transceivers & Chipset suppliers had collaborated in the market to retain the opportunities emerging with on-going development of V2V market ecosystem.

DSRC Technology Market report is segmented as below:

A. Dedicated Short Range Communication Technology Market – By Offering

1. Automotive OEM’s

I. Internal Combustion Engine Based Vehicle
II. Passenger Vehicle

i. Small Car
ii. Sedan
iii. Sports Utility Vehicles
iv. Luxury
v. Others

2. Commercial Vehicle

I. Small Truck
II. Medium Truck
III. Heavy Truck
IV. Bus
V. Trailers
VI. Others

3. Battery Operated Vehicle

I. Passenger Vehicle
II. Small Car
III. Sedan
IV. Sports Utility Vehicles
V. Luxury
VI. Others
VII. Commercial Vehicle

4. Aftermarket

I. Retail Establishments
II. Gas Stations
III. Mass Transits
IV. Rail
V. Parking Lots
VI. Others

B. Dedicated Short Range Communication Technology Market – By Transceiver

1. On Board Unit

I. Standalone
II. Hybrid

2. Roadside Unit

C. Dedicated Short Range Communication Technology Market – By Technical Specifications

1. Technology

I. Active DSRC
II. Passive DSRC

2. By Electromagnetic Spectrum

I. Microwave
II. Infrared

3. By Standards

I. ASTM
II. IEEE
III. ISO
IV. SAE
V. AASHTO
VI. ITS America

D. Dedicated Short Range Communication Technology Market – By Frequency Band

1. 5.8 GHz
2. 5.9 GHz

E. Dedicated Short Range Communication Technology Market – By Application

1. Transit signal priority
2. Transit vehicle refueling management
3. Personalized taxi dispatch services
4. Integrated transportation financial transactions
5. Enhanced truck roadside inspection
6. Real time freight logistics
7. Pedestrian safety at intersections
8. Routing and scene management for emergency services
9. Advanced highway-rail and highway-transit grade crossings
10. Others

F. DSRC Technology Market by Geography (covers 10+ countries)
G. DSRC Technology Entropy Market

Manufacturer Citied / Interviewed in DSRC Technology Market

1. Q-Free ASA
2. Qualcomm Inc./Nxp Semiconductors
3. Oki Electric Industry Co. Ltd.
4. Continental AS
5. Autotalks Ltd
6. Company 6
7. Company 7
8. Company 8
What can you expect from the report?
The DSRC Technology Market Report is Prepared with the Main Agenda to Cover the following 20 points:

1. Market Size by Product Categories & Application 11. Demand Analysis (Revenue & Volume)
2. Market trends & Relevant Market Data 12. Country level Analysis
3. Manufacturer Landscape 13. Competitor Analysis
4. Distributor Landscape 14. Market Shares Analysis
5. Pricing Analysis 15. Value Chain Analysis
6. Top 10 End user Analysis 16. Supply Chain Analysis
7. Product Benchmarking 17. Strategic Analysis
8. Product Developments 18. Current & Future Market Landscape Analysis
9. Mergers & Acquisition Analysis 19. Opportunity Analysis
10. Patent Analysis 20. Revenue and Volume Analysis

Frequently Asked Questions:
Q. Does IndustryARC publish country or application based reports inDSRC Technology Market segment?
Response: Yes, we do have separate reports as mentioned below:

1. America DSRC Technology Market Report (2018-2023)
2. Europe DSRC Technology Market Size(2018-2023)
3. Asia-Pacific DSRC Technology Market Analysis(2018-2023)
4. OfferingDSRC Technology Market Growth(2018-2023)
5. TransreceiverDSRC Technology Market Share(2018-2023)
6. Technical SpecificationDSRC Technology Market Forecast (2018-2023)
7. Frequency Band DSRC Technology Market Insights(2018-2023)
8. Application DSRC Technology Market (2018-2023)
Q. Does IndustryARC provide customized reports and charge additionally for limited customization?
Response:Yes, we can customize the report by extracting data from our database of reports and annual subscription databases. We can provide the following free customization:
1. Increase the level of data in application or end user industry.
2. Increase the number of countries in geography chapter.
3. Find out market shares for other smaller companies or companies which are of interest to you.
4. Company profiles can be requested based on your interests.
5. Patent analysis, pricing, product analysis, product benchmarking, value and supply chain analysis can be requested for a country or end use segment.

Any other custom requirements can be discussed with our team, drop an e-mail to sales@industryarc.com to discuss more about our consulting services.


Media Contact:
Mr. Venkat Reddy
Sales Manager
Email 1: sales@industryarc.com
Or Email 2: venkat@industryarc.com
Contact Sales: +1-614-588-8538 (Ext-101)

About IndustryARC:IndustryARC is a Research and Consulting Firm that publishes more than 500 reports annually, in various industries such as Agriculture, Automotive, Automation & Instrumentation, Chemicals and Materials, Energy and Power, Electronics, Food & Beverages, Information Technology, Life sciences & Healthcare.

A Quick Look At The Latest Happenings In The Driver Monitoring Systems Market

Europe held the largest market share in the Driver Monitoring System Market:
Europe region holds the largest market share in the Driver Monitoring System Market and is anticipated to reach $4.18 billion by 2023 at a CAGR of 10.8%. However, APAC witnesses highest growth during the forecast period and is expected to reach $2 billion by 2023 at a CAGR of 14.7%. The economic conditions in entire Europe are good and people have the purchasing power to buy more sophisticated products. Thus, the European market is expected to grow. The key technologies in the region are Image Sensing/Cameras, Pressure Mats, Infrared Sensing, Strain Gauges among others.

driving.jpg

Selected Value Chain Analysis done in the Driver Monitoring System Market report:

  • Driver Monitoring Market is predominantly business to business in nature. The major components are not end users of the product, but rather they tend to be the big market players such as Ford, Toyota, Volvo, Mercedes, and Renault which are majorly into the vehicle management
  • The enhancement in the product value takes place in the Driver Monitoring Systems industrystarting from the designing stage and then manufacturing of chips and sensors
  • which takes place inside the semiconductor fabrication labs. Then along with the linear an
  • nonlinear components, these components are assembled in order to get the product working

which is then tested and verified in the next step:
There are two ways the business is performed. In the B2B model, the system is sold to the Big market players in the motor vehicles segment for integration of the system with their vehicle from where the product reaches to the end user who are not the consumers in this model of business.
In another business model called B2C or business to customer, wherein the end user forms the consumer base as well, the supply chain is slightly different in the sense that the end product now, rather than going to a vehicle manufacturing for integration with their vehicle, the product is supplied to a retailer to sell it to the end user directly. Such products are known for the aftermarket products. This system has an added advantage that the latest technology can be accommodated to keep up the modified norms for driver safety measurement system and monitoring systems.

Excerpts on Driver Monitoring System Market Growth Factors:

  • The global market for advanced driver assistance systems has grown substantially in the recent years, as vehicle companies have increased the safety content of their vehicles in response to the market and government regulations.
  • The current global driver monitoring systems market is estimated to propel with the growing number of vehicles on the road and the demand for safety from consumers coupled with government legislation (Europe) and other regulatory body requirements.
  • Safety norms are not the only reason for their high growth; growing personal safety concerns are also playing an imperative role in the rising demand for driver management softwares in passenger cars.
  • Sensors of various types form a major part of the vehicle monitoring systems, and their demand in the market is likely to experience rapid growth in the future.
    Limited patent validity necessitates companies to come up with newer technologies
    and innovative products to cater to the growing demand of the automotive technology.
  • Image Sensing/Cameras is the dominant segment for driver monitoring systems market. It is anticipated to reach $1 b by 2023 growing at a CAGR of 11.8% throughout the forecast period
  • Pressure mats is projected to reach $844.80m by 2023 growing at a CAGR of 12.3% throughout the forecast period

To access / purchase the full report browse the link below:

https://industryarc.com/Report/172/driver-monitoring-systems-global-market-report.html

Key players of Driver Monitoring Systems Market:
• The major acquisitions involved in this market are acquisition of ASL Vision by Continental Automotive, acquisition of Electronics Business of Johnson Controls by Visteon and many more. Collaboration such as DENSO – NEC Corporation collaboration impacted on the growth of driver monitoring system market.
• Since, scope of technology innovation is high; threat of new players in the market also increases correspondingly. But the market already has numerous players that are striving hard to deliver cutting-edge technologies to lead in global driver monitoring systems products.
• The key players in the Driver Monitoring Systems include: Aisin Seiki Co Ltd., Autoliv Inc., Continental Automotive Systems, Delphi, Denso, Johnson Controls, Valeo, Visteon, Magnet, Marelli and Robert Bosch GmbH.
Driver Monitoring Systems Market Report is segmented as indicated below:
Driver Monitoring Systems Market By Key Technology:
1. Image Sensing/Cameras
2. Pressure Mats
3. Infrared Sensing
4. Strain Gauges
5. Steering Angle Sensors
6. Others
Driver Monitoring Systems Market By Type of Monitoring
1. Driver Alertness/Distraction Monitoring
2. Driver Fatigue Monitoring
3. Drunk Driving Monitoring
Driver Monitoring Systems Market By Geography (Covers 10 + Countries)
Driver Monitoring Systems Market By Entropy

Companies Cited/Referenced/Interviewed in Driver Monitoring System Market :
• Continental
• Bosch
• Valeo
• Magna
• Denso
• Delphi
• Hella
• Aisin
• TRW
What can you expect from the report?
The Driver Monitoring Systems Market is Prepared with the Main Agenda to Cover the following 20 points:
1. Market Size by Product Categories
2. Market trends
3. Manufacturer Landscape
4. Distributor Landscape
5. Pricing Analysis
6. Top 10 End user Analysis
7. Product Benchmarking
8. Product Developments
9. Mergers & Acquisition Analysis
10. Patent Analysis
11. Demand Analysis (By Revenue & Volume)
12. Country level Analysis (15+)
13. Competitor Analysis
14. Market Shares Analysis
15. Value Chain Analysis
16. Supply Chain Analysis
17. Strategic Analysis
18. Current & Future Market Landscape Analysis
19. Opportunity Analysis
20. Revenue and Volume Analysis
FAQ:

Does IndustryARC publish country, geography or application based reports in Driver Monitoring Systems Market?
Yes, we do have separate reports as mentioned below:
1. Americas Market for Driver Monitoring Systems Report(2018-2023)
2. Europe Market for Driver Monitoring Systems Size(2018-2023)
3. APAC Market for Driver Monitoring Systems Analysis(2018-2023)
4. RoW Market for Driver Monitoring Systems Trends(2018-2023)
5. Image Sensing/Cameras Market for Driver Monitoring Systems Growth (2018-2023)
6. Pressure Mats Market for Driver Monitoring Systems (2018-2023)
7. Infrared Sensing Market for Driver Monitoring Systems (2018-2023)
8. Strain Gauges Market for Driver Monitoring Systems (2018-2023)
9. Steering Angle Sensors Market for Driver Monitoring Systems (2018-2023)
10. Driver Alertness/Distraction Monitoring Market for Driver Monitoring Systems (2018-2023)
11. Driver Fatigue Monitoring Market for Driver Monitoring Systems (2018-2023)
12. Drunk Driving Monitoring Market for Driver Monitoring Systems (2018-2023)
Does IndustryARC customize these reports and charge additionally for limited customization?
Yes, we can customize the report by extracting data from our database of reports and annual subscription databases. We can provide the following free customization:
1. Increase the level of data in application or end user industry.
2. Increase the number of countries in geography chapter.
3. Find out market shares for other smaller companies or companies which are of interest to you.
4. Company profiles can be requested based on your interest.
5. Patent analysis, pricing, product analysis, product benchmarking, value and supply chain analysis can be requested for a country or end use segment.

Any other major customizations can be discussed with our team, we can provide a separate quote based on your requirement. You can drop in an e-mail to sales@industryarc.com to discuss more about our consulting services.

Media Contact:
Mr. Venkat Reddy
Sales Manager
Email 1: sales@industryarc.com
Or Email 2: venkat@industryarc.com
Contact Sales: +1-614-588-8538 (Ext-101)
About IndustryARC:
IndustryARC is a Research and Consulting Firm that publishes more than 500 reports annually, in various industries such as Agriculture, Automotive, Automation & Instrumentation, Chemicals and Materials, Energy and Power, Electronics, Food & Beverages, Information Technology, Life sciences &Healthcare.

A Quick Look At The Latest Happenings In The Dosing Systems Market

Europe to dominate the Dosing Systems Market during the forecast period:

Europe is expected to have the largest share in the Dosing Systems Market during the forecast period. It is expected to reach $2036.2 million by 2023 at a CAGR of 3.10%. North America will experience a growth of $1,934 million by 2023 at a CAGR of 3.6%. Asia Pacific is expected to have the highest growth due to the increasing needs from water and waste water treatment industries. The need for clean drinking water in Asia Pacific also spurs the need for dosing systems. The countries in the Middle East will have more demand for dosing systems in water treatment as increasing demand for clean drinking water is observed in the region.

Dosing

Selected Analysis done in the Dosing Systems Market Report:

The water treatment segment is expected to experience the largest growth in the Dosing Systems Market during the forecast period. It is expected to have a growth of $2351.9 million at a CAGR of 5.9% by 2023. This is due to the growing demand for water treatment in the Asia Pacific. Power generation is the second largest segment and will reach $1636.4 million by 2023 at a CAGR of 4.2%. Water treatment is an industrial process which makes contaminated water suitable for various purposes such as drinking, industrial use, agriculture, medicine. The water contaminants are removed or the concentration of the contaminants is reduced to make it safe for use. Different processes such as settling and filtration, and chemical processes such as disinfection and coagulation are used for water treatment.

Excerpts on Dosing Systems Market Growth Factors:

• The recent developments in the dosing systems have led to the production of automated solutions of low cost. They reduce human interference and provide accurate injection of chemicals during the dosing process. This factor drives the Dosing Systems Market.

• Increasing need for drinking water and waste water treatment enhances the growth of dosing systems in the Asia Pacific.

• Growth of the oil & gas and energy industry will enhance the growth of the Dosing Systems Market.

To access / purchase the full report browse the link below:

https://industryarc.com/Report/1253/dosing-systems-market-forecast.html
Key players of the Dosing Systems Market:

The key players of the Dosing Systems Market are IDEX Corporation, Grundfos Holdings A/S,
Lewa GmbH, NETZSCH and Prominent Group. IDEX Corporation is specialized in highly engineered fluidics systems and components along with fire and safety products. Grundfos is an advanced pump solutions provider in water technology. Pumps for air conditioning, ventilation and heating are also provided by Grundfos. Lewa GmbH meets the end users’ needs for support in design phase of system engineering and handling of fluids. NETZSCH makes positive displacement pumps worldwide. These pumps are used in oil & gas and mining industry. Prominent Group makes components and systems for fluid handling and water treatment.
Dosing Systems Market is segmented as below:

Growing end user industries such as oil & gas, power generation, and chemical processing drive the Dosing Systems Market.

A. Dosing Systems Market By Application
1. Water Treatment
2. Power Generation
3. Oil & Gas
4. Chemical Processes
5. Food & Beverages
6. Others

B. Dosing Systems Market By Technology Type
1. Diaphragm
2. Plunger/Piston
3. Cavity
4. Peristaltic
5. Others

C. Dosing Systems Market by Geography (covers 14+ countries)
D. Dosing Systems Market Market Entropy

Companies Cited / Interviewed in Dosing Systems Market:

1. ADVANCED HOLDINGS LTD
2. ALLTECH DOSIERANLAGEN GMBH
3. BUHLER AG
4. BRIGHTWELL DISPENSERS LTD.
5. DIOXIDE PACIFIC PTY LTD
6. DOYEN MACHINERY CO., LTD
7. FRAMES
8. GRUNDFOS
9. IDEX CORPORATION
10. LEWA GROUP
11. METITO HOLDINGS LIMITED
12. Company 12
13. Company 13
14. Company 14
15. Company 15+
What can you expect from the report?
The Dosing Systems Market Report is Prepared with the Main Agenda to Cover the following 20 points:

1. Market Size by Product Categories & Application 11. Demand Analysis (Revenue & Volume)
2. Market trends & Relevant Market Data 12. Country level Analysis
3. Manufacturer Landscape 13. Competitor Analysis
4. Distributor Landscape 14. Market Shares Analysis
5. Pricing Analysis 15. Value Chain Analysis
6. Top 10 End user Analysis 16. Supply Chain Analysis
7. Product Benchmarking 17. Strategic Analysis
8. Product Developments 18. Current & Future Market Landscape Analysis
9. Mergers & Acquisition Analysis 19. Opportunity Analysis
10. Patent Analysis 20. Revenue and Volume Analysis

Frequently Asked Questions:
Q. Does IndustryARC publish country or application based reports in Dosing Systems segment?
Response: Yes, we do have separate reports as mentioned below:
1. North America Dosing Systems Market Report(2018-2023)
2. Europe Dosing Systems Market Size(2018-2023)
3. Asia Pacific Dosing Systems Market Analysis(2018-2023)
4. Water Treatment Dosing Systems Market Growth(2018-2023)
5. Power Generation Dosing Systems Market Share(2018-2023)
6 . Oil & Gas Dosing Systems Market(2018-2023)
7. Chemical Processes Dosing Systems Market(2018-2023)
8. Food & Beverages Dosing Systems Market(2018-2023)

Q. Does IndustryARC provide customized reports and charge additionally for limited customization?
Response: Yes, we can customize the report by extracting data from our database of reports and annual subscription databases. We can provide the following free customization:
1. Increase the level of data in application or end user industry.
2. Increase the number of countries in geography chapter.
3. Find out market shares for other smaller companies or companies which are of interest to you.
4. Company profiles can be requested based on your interest.
5. Patent analysis, pricing, product analysis, product benchmarking, value and supply chain analysis can be requested for a country or end use segment.

Any other custom requirements can be discussed with our team, drop an e-mail to sales@industryarc.com to discuss more about our consulting services.

Media Contact:
Mr. Venkat Reddy
Sales Manager
Email 1: sales@industryarc.com
Or Email 2: venkat@industryarc.com
Contact Sales: +1-614-588-8538 (Ext-101)

About IndustryARC: IndustryARC is a Research and Consulting Firm that publishes more than 500 reports annually, in various industries such as Agriculture, Automotive, Automation & Instrumentation, Chemicals and Materials, Energy and Power, Electronics, Food & Beverages, Information Technology, Life sciences & Healthcare.

A Quick Look At The Latest Happenings In The Visible Light Communications Market

Europe market dominates with major share and growth in the Visible Light Communication Market:

Europe remained the significant market for VLC developments in 2017. Thevisible light communications market for Europe will dominate at a growing CAGR of 119.49% to reach value of $545.41 million by 2023.Americas region for visible light communications market is estimated to have a rapid growth rate of CAGR 142% to reach a value of $261.11 million by 2023 from $1.3 million in 2017. U.S. is the early adopter of the VLC technology in the Americas region and has been improving the technology penetration across all the industry. Asia-Pacific will face lower adoption of vision light communication products as low awareness regarding the benefits of these products will hinder the penetration. The APAC market is expected to grow at a CAGR of 130.45% to reach a value of $104.84 million by 2023.

VLC.png

Selected Component Analysis done in the Visible Light Communications (VLC) Market Report:

Visible light communications technology is categorized into two components that include Access Points and Stations Points. Access points segment is the dominating segment for visible light communication market. The Access point market is expected to grow at a CAGR of 116.7% to reach value of $508.78 million by 2023. Light source such as fluorescent light, LED, light spectrum and others are used for illumination and transmitting photonic signals simultaneously. In Access Station market, the retail segment is the leading segment to gain highest revenue in the market. Station point segment is the fastest growing segment, increasing at CAGR of 144.08% to reach value of $401.74 million by 2023.In station point market, commercial segment is the leading vertical and is expected to continue its dominance for the forecast period of 2018-2023.

Excerpts on Visible Light Communications (VLC) Market Growth Factors:

  • Improvement in performance of efficient and durable LED light basefor industrial and domestic applications for indoor and outdoor use coupled with advancement in technology created scope for development of VLC systems.
  • Strong increasing demand in indoor positioning and monitoring systems in end use sector, and personalised services, high bandwidth requirementswill help the market to grow further.
  • Rapid adoption of communication technology and exponential increase in the number of internet users is projected to drive the market in next few years.

To access / purchase the full report browse the link below

https://industryarc.com/Report/15036/visible-light-communications-market.html

Key players of the Visible Light Communication Market:

OLEDCOMM S.A.S, PureLiFi, Firefly Wireless Networks, and Axrtek are the dominant players in the visible light communication market. OLEDCOMM S.A.S. such lists of products its offering SINCEEEE are GEOLiFi and LiFiNET used in applications like Museums and Art Gallery, Retails, Hospitals, Offices and Smartcities. PureLiFi Ltd. has product likeLiFi – X and Li-Flame. The product are used for Mobile Connectivity, Smart Lighting, Hazardous Environments, RF light Spectrum Relief, Vehicles and Transportation and Location based Services.Firefly Wireless Networks comprises products as Office SecureLink, M2MSecureLink, Transit SecureLink, Vehicle SecureLink usedfor Secure Network Access, Factories, Consumer electronics, Hospitals, Vehicles, Train stations, Underwater Applications, nuclear and public utilities and others.

Visible Light Communication Market report is segmented as below:

A. Visible Light Communications Market – By Components

1. Access Points
2. Station Points

B. Visible Light Communications Market – By Applications

1. Indoor Applications
2. Outdoor Applications
3. Underwater Communications

C. Visible Light Communications Market – By End-User Industry

1. Retail
2. Museums & Art Gallery
3. Hospital
4. Commercial
5. Residential
6. Smart Cities
7. Aviation
8. Transportation
9. Others

D. Visible Light Communication Market by Geography (covers 10+ countries)
E. Visible Light Communication Entropy Market
F. Manufacturer Citied / Interviewed

1. Avago Technologies
2. Casio Computer Co., Ltd.
3. Panasonic Corporation
4. LVX Systems
5. Lightpointe Communications, Inc.
6. Gallium Lighting, Llc
7. Koninklijke Philips N.V.
8. Nakagawa Laboratories, Inc.
9. NEC Corporation
10. Outstanding Technology Co. Ltd.
11. Velmenni
12. Company 12
13. Company 13
14. Company 14
15. Company 15+

What can you expect from the report?
The Visible Light Communication Market Report is Prepared with the Main Agenda to Cover the following 20 points:

1. Market Size by Product Categories & Application 11. Demand Analysis (Revenue & Volume)
2. Market trends & Relevant Market Data 12. Country level Analysis
3. Manufacturer Landscape 13. Competitor Analysis
4. Distributor Landscape 14. Market Shares Analysis
5. Pricing Analysis 15. Value Chain Analysis
6. Top 10 End user Analysis 16. Supply Chain Analysis
7. Product Benchmarking 17. Strategic Analysis
8. Product Developments 18. Current & Future Market Landscape Analysis
9. Mergers & Acquisition Analysis 19. Opportunity Analysis
10. Patent Analysis 20. Revenue and Volume Analysis

Frequently Asked Questions:
Q. Does IndustryARC publish country or application based reports inVisible Light Communication Market segment?
Response: Yes, we do have separate reports as mentioned below:

1. America Visible Light Communication Market Report(2018-2023)
2. Europe Visible Light Communication Market Share(2018-2023)
3. Asia-Pacific Visible Light Communication Market Analysis (2018-2023)
4. ComponentVisible Light Communication Market Size(2018-2023)
5. ApplicationVisible Light Communication Market Growth (2018-2023)
6. End-UserVisible Light Communication Market (2018-2023)
Q. Does IndustryARC provide customized reports and charge additionally for limited customization?
Response:Yes, we can customize the report by extracting data from our database of reports and annual subscription databases. We can provide the following free customization:
1. Increase the level of data in application or end user industry.
2. Increase the number of countries in geography chapter.
3. Find out market shares for other smaller companies or companies which are of interest to you.
4. Company profiles can be requested based on your interests.
5. Patent analysis, pricing, product analysis, product benchmarking, value and supply chain analysis can be requested for a country or end use segment.

Any other custom requirements can be discussed with our team, drop an e-mail to sales@industryarc.com to discuss more about our consulting services.

Media Contact:
Mr. Venkat Reddy
Sales Manager
Email 1: sales@industryarc.com
Or Email 2: venkat@industryarc.com
Contact Sales: +1-614-588-8538 (Ext-101)

About IndustryARC:IndustryARC is a Research and Consulting Firm that publishes more than 500 reports annually, in various industries such as Agriculture, Automotive, Automation & Instrumentation, Chemicals and Materials, Energy and Power, Electronics, Food & Beverages, Information Technology, Life sciences & Healthcare.

A Peek At The Immediate Future of the Uninterruptible Power Supply Market

APAC held the largest market share and Growth Rate in the Uninterruptible Power Supply Market:
APAC region holds the largest market share and growth in the global UPS Market and is anticipated to reach $7.4 billion by 2023 at a CAGR of 5.7%. The rapid development of cloud computing and big data has brought the new-found demand for in-house storage and analytics capabilities to support the business needs of the enterprises, which in turn uplifted the Uninterruptible Power Supply Market in this region. The key applications include personal computers, Data Centers, and Network among others.

ups
Selected Value Chain Analysis done in the Uninterruptible Power Supply report:

  • The value chain of Uninterruptible Power Supply Market encompasses various stages of the product from procurement to pricing.
  • The Uninterruptible Power Supply Market integrators procured the components from component suppliers (such as battery electronic components, and enclosure providers) and assembled to the final product. These final products upon rigorous testing (here testing and certification bodies influence the product as they ensure the reliability and robustness of the product) will be up for the final delivery. They will be distributed to the regional distribution hubs, local distribution hubs, and to the retailers by the third-party distributors.
  • The UPS units will then be installed at the end-user’s respective operational locations by The local distributors.
  • Based on the requirement, the third-party contractors who also offer repair, maintenance, and replacement services will procure the UPS systems from either the distributors or the UPS suppliers and install it in various locations. Also, they take care of the recycling process that include the safe disposable of harmful effluents in the UPS systems. Thus, these stakeholders play a pivotal role in all end-user verticals except the residential sector.
  • The regulatory bodies are not of least concern as they have a significant impact on component use especially batteries and thereby the pricing of the products. Moreover, they keep a tap of compliance of environmental standards at each stage.

Excerpts on Uninterruptible Power Supply Growth Factors:

  • The demand for energy efficient uninterrupted power supplies in both residential and industrial Uninterruptible Power Supply Markets are set to drive the market during the forecast period.
  • The growing infrastructure establishments and urbanization in the Rest of the World is set to drive the uninterruptible power supply market in the future.
    Growing demand for continuous power supply and protecting equipment from voltage fluctuations is driving the growth of the global uninterrupted power supply market.
  • Other factors including high penetration of industrial M2M communications, rising adoption for hybrid solar UPS, and growth of large data centers.

To access / purchase the full report browse the link below
https://industryarc.com/Report/15004/uninterruptible-power-supply-market.html

Key players of Uninterruptible Power Supply Market:

  • Vertiv (Emerson Network Power), Eaton, Schneider Electric, and Gamatronic are considered as the top five players in the Uninterruptible Power Supply Market.
    Conglomerates in the Uninterruptible Power Supply Market mainly concentrates on products launches and acquisitions as their key strategy as they accounted for 84% of the total developments.
  • Also, the effort and time of these companies was centered towards developing the technologies to offer differentiated and more efficient products.

Uninterruptible Power Supply Market Report is segmented as indicated below:

Uninterruptible Power Supply Market By Power Rating:
1. Introduction
2. Below 15 kVA
3. 1.5-1.30 kVA
4. 30.1-1-50kVA
5. 50.1-100 kVA
6. 100.1-200 kVA
7. Above 200.1 kVA
8. Others
Uninterruptible Power Supply Market By Type
1. Introduction
2. Offline
3. Line Interactive
4. On-Line Double Conversion
5. Others
Uninterruptible Power Supply Market By Application
1 Introduction
2 Personal Computers
3 Server and Racks
4 Network
5 Data Centers
6 Marine & Offshore
7 Others
Uninterruptible Power Supply Market by End User Industry
1. Introduction
2. Commercial
3. Industrial
4. Medical
5. Telecommunication
6. Others
Uninterruptible Power Supply Market By Geography (Covers 12 + Countries)
Uninterruptible Power Supply Market By Entropy
Companies Cited/Referenced/Interviewed in Uninterruptible Power Supply market
• Siemens AG
• Mitsubishi Electric Corporation
• Legrand
• Toshiba Corporation
• Riello Electronica Group
• General Electric Company
• Company 7
• Company 8
• Company 9
• Company 10
• Company 11
• Company 12
• Company 13
• Company 14
• Company 15
• Company 16
• Company 40+
What can you expect from the report?
The Uninterruptible Power Supply Market is Prepared with the Main Agenda to Cover the following 20 points:
1. Market Size by Product Categories
2. Market trends
3. Manufacturer Landscape
4. Distributor Landscape
5. Pricing Analysis
6. Top 10 End user Analysis
7. Product Benchmarking
8. Product Developments
9. Mergers & Acquisition Analysis
10. Patent Analysis
11. Demand Analysis (By Revenue & Volume)
12. Country level Analysis (15+)
13. Competitor Analysis
14. Market Shares Analysis
15. Value Chain Analysis
16. Supply Chain Analysis
17. Strategic Analysis
18. Current & Future Market Landscape Analysis
19. Opportunity Analysis
20. Revenue and Volume Analysis
FAQ:
Does IndustryARC publish country, geography or application based reports in Uninterruptible Power Supply Market?
Yes, we do have separate reports as mentioned below:
1. Americas Market for Uninterruptible Power Supply Share(2018-2023)
2. Europe Market for Uninterruptible Power Supply Forecast(2018-2023)
3. APAC Market for Uninterruptible Power Supply Size(2018-2023)
4. RoW Market for Uninterruptible Power Supply Value(2018-2023)
5. Below 15 kVA Market for Uninterruptible Power Supply insights (2018-2023)
6. 1.5-1.30 kVA Market for Uninterruptible Power Supply Growth(2018-2023)
7. 30.1-1-50kVA Market for Uninterruptible Power Supply Repport(2018-2023)
8. 50.1-100 kVA Market for Uninterruptible Power Supply (2018-2023)
9. 100.1-200 kVA Market for Uninterruptible Power Supply (2018-2023)
10. Above 200.1 kVA Market for Uninterruptible Power Supply (2018-2023)
11. Offline Market for Uninterruptible Power Supply (2018-2023)
12. Line Interactive Market for Uninterruptible Power Supply (2018-2023)
13. On-Line Double Conversion Market for Uninterruptible Power Supply (2018-2023)
14. Personal Computers Market for Uninterruptible Power Supply (2018-2023)
15. Server and Racks Market for Uninterruptible Power Supply (2018-2023)
16. Network Market for Uninterruptible Power Supply (2018-2023)
17. Data Centers Market for Uninterruptible Power Supply (2018-2023)
18. Marine & Offshore Market for Uninterruptible Power Supply (2018-2023)
19. Commercial Market for Uninterruptible Power Supply (2018-2023)
20. Industrial Market for Uninterruptible Power Supply (2018-2023)
21. Medical Market for Uninterruptible Power Supply (2018-2023)
22. Telecommunication Market for Uninterruptible Power Supply (2018-2023)

Does IndustryARC customize these reports and charge additionally for limited customization?
Yes, we can customize the report by extracting data from our database of reports and annual subscription databases. We can provide the following free customization:
1. Increase the level of data in application or end user industry.
2. Increase the number of countries in geography chapter.
3. Find out market shares for other smaller companies or companies which are of interest to you.
4. Company profiles can be requested based on your interest.
5. Patent analysis, pricing, product analysis, product benchmarking, value and supply chain analysis can be requested for a country or end use segment.

Any other major customizations can be discussed with our team, we can provide a separate quote based on your requirement. You can drop in an e-mail to sales@industryarc.com to discuss more about our consulting services.

Media Contact:
Mr. Venkat Reddy
Sales Manager
Email 1: sales@industryarc.com
Or Email 2: venkat@industryarc.com
Contact Sales: +1-614-588-8538 (Ext-101)
About IndustryARC:
IndustryARC is a Research and Consulting Firm that publishes more than 500 reports annually, in various industries such as Agriculture, Automotive, Automation & Instrumentation, Chemicals and Materials, Energy and Power, Electronics, Food & Beverages, Information Technology, Life sciences &Healthcare.